Seafood's Contributions
At Seafood Collaborators, We Believe:
The Seafood Industry has come a long way
There remains a lot of work to do
Seafood has a great story vital to our wellbeing that must be amplified
- Seafood Contributions
We invite you to study seafood’s many contributions below and share the data using the links provided.
Except as otherwise noted, data are from FAO reports shown at the bottom of this page.
9.1% = 733 Million
% of undernourished people in
the world in 2023
(vs 7.9% in 2019)
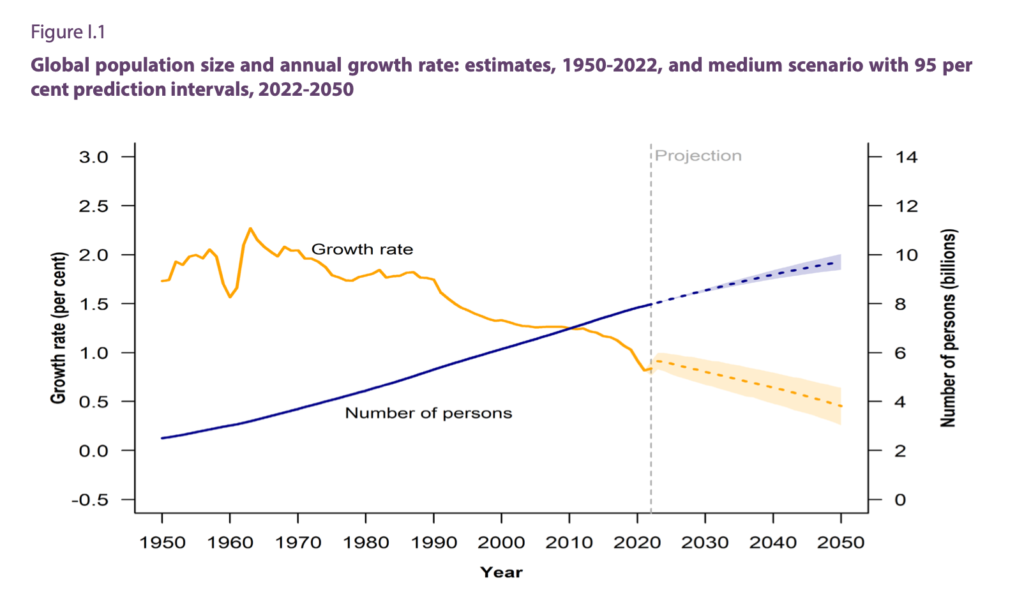
2.3 billion people
# of moderately or
severely food insecure in 2023
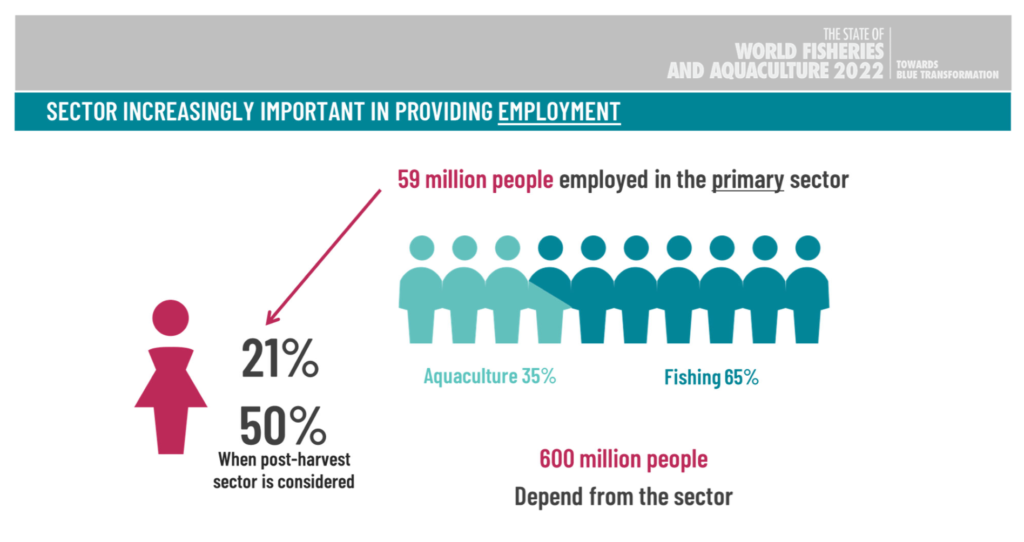
600 Million
# of people fully or partially dependent
on the sector for their livelihoods in 2022
Seafood Collaborators
Seafood Collaborators
Seafood Collaborators
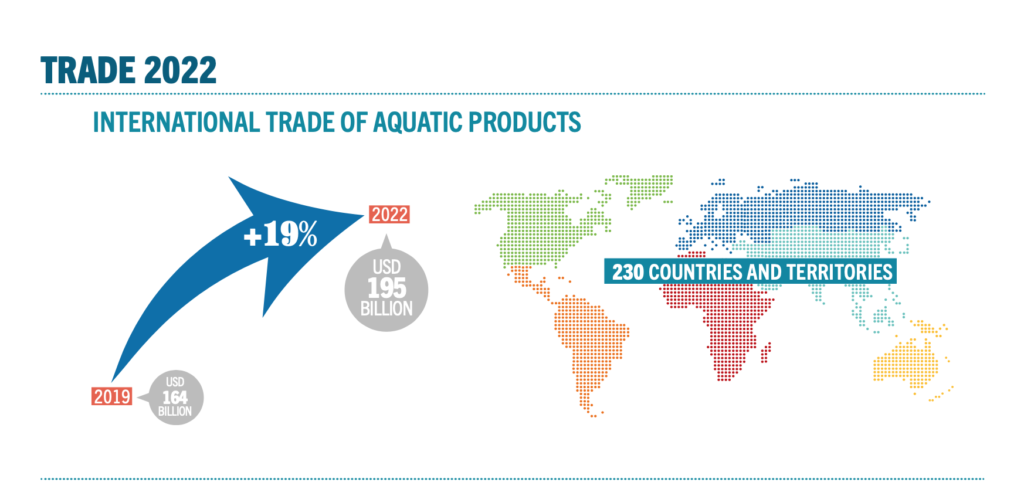
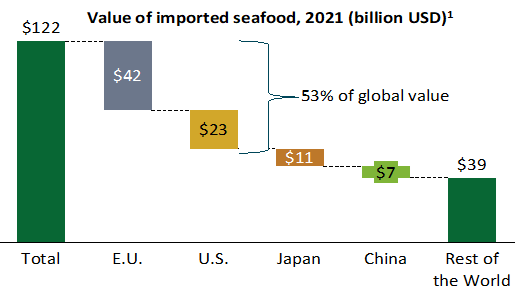
“The quantity of globally traded seafood continues to grow. Asian seafood exports to North America remain the largest flow of seafood traded globally. The US and EU—markets with a strong demand for sustainable seafood—remain the highest-value importers of seafood, accounting for over half of the global imported value. China’s imports represent only 5.5% of global import value.”
Source (2022): https://oursharedseas.com/wp-content/uploads/2022/09/2022-Progress-Toward-Sustainable-Seafood-By-the-Numbers.pdf
Seafood Collaborators
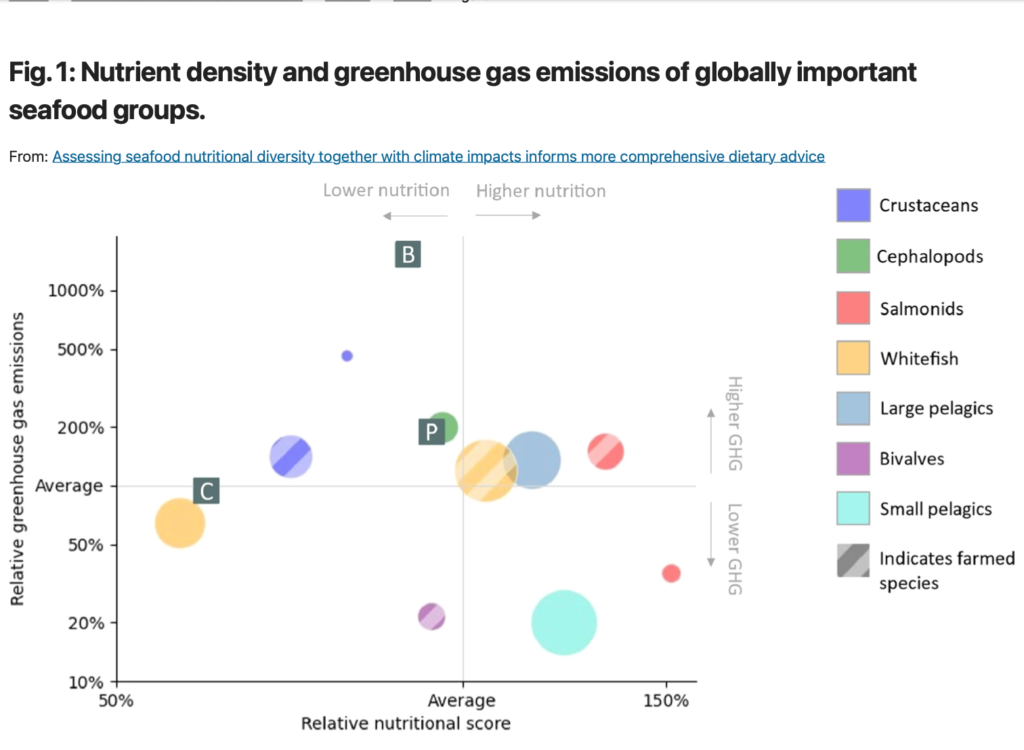
“Relative nutrient density and production-related GHG emissions (i.e. post-harvest emissions are excluded) per edible weight of globally important seafood groups from fisheries (solid colours) and aquaculture (striped) at the point of landing or harvest, along with beef (B), chicken (C) and pork (P). Relative size of seafood group bubbles is proportionate to 2015 global edible weight production volumes, and GHG and nutrient density values are weighted by species”.
“The global average performance of all seafood assessed, weighted by species production volume (the two lines in Fig. 1), has a higher nutrient density than beef, pork and chicken and lower GHG emissions than beef and pork.”
Source (2022): https://www.nature.com/articles/s43247-022-00516-4
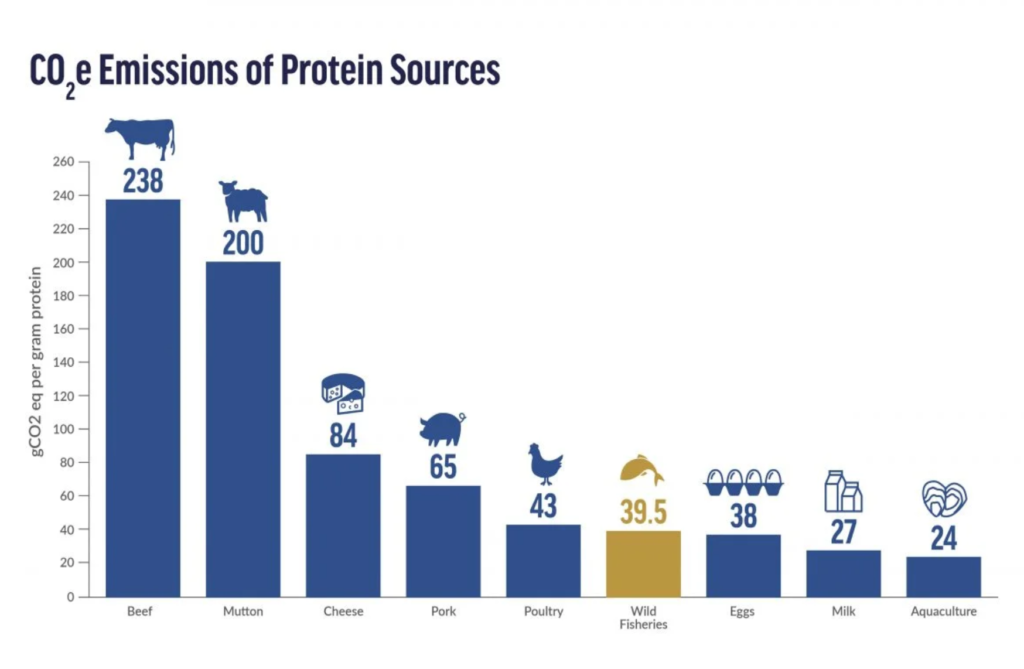
“We have long known that wild fisheries have lower CO2 emissions than beef, mutton, cheese, pork, and poultry. Wild fisheries also require virtually no fresh water or land to harvest. This conclusion is once again supported by new research from Dr. Jessica Gephart, an Oceana Science Advisor and Assistant Professor of Environmental Science at American University.
Led by Gephart and supported by 17 other researchers around the world, this latest assessment of aquatic foods is the most comprehensive one to date. Researchers analyzed the greenhouse gas emissions, freshwater use, land use, and nitrogen and phosphorus emissions of 23 species groups accounting for more than 70% of the world’s “blue food” production, which refers to both aquaculture products (or farmed fish and shellfish) and capture products (or “wild” foods from the ocean and inland waters).”
Source (2021): https://oceana.org/blog/wild-seafood-has-lower-carbon-footprint-red-meat-cheese-and-chicken-according-latest-data/
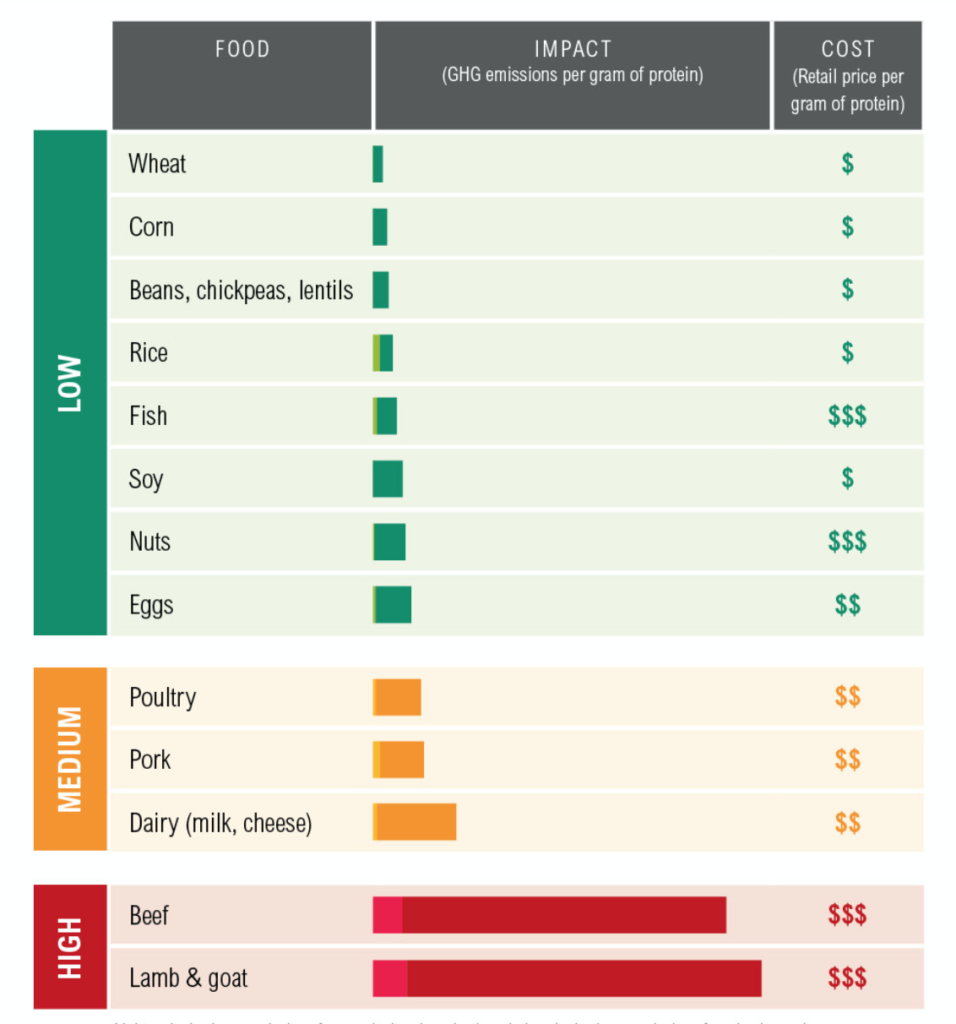
Source (2016): https://www.wri.org/data/protein-scorecard
Seafood Collaborators
FAO SOURCES
(click to access)

